
1. Why “One Number” Misleads on Commercial Payback
The real payback period depends on the building’s hot water demand, the fuel being displaced, the solar fraction, the installed cost, and any incentives that actually apply at the time the project is built. The U.S. Department of Energy makes the same point: solar water heating economics depend on hot water use, system performance, location, incentives, and the cost of the conventional fuel replaced (see the DOE’s consumer guidance on solar water heaters).
That is also why many payback claims in the market are hard to trust. Some proposals start from a collector efficiency headline instead of the building’s actual demand profile. Others assume unrealistically high solar contribution, or ignore operating realities such as pumps, controls, backup heating, and periodic maintenance. A credible business case starts with thermodynamics, then avoided energy cost, and only then ROI.
Facility and finance teams are right to ask for a payback number — but the useful output is a set of scenario outcomes (baseline fuel A vs. B, with and without verified incentives), not a single slide with an optimistic solar fraction.
National-lab and federal guidance align on this pattern: the National Renewable Energy Laboratory (NREL) frequently highlights that savings are especially significant when solar thermal displaces electric-resistance water heating — a point worth treating as a first-order check on any pro forma (see NREL solar thermal resources).
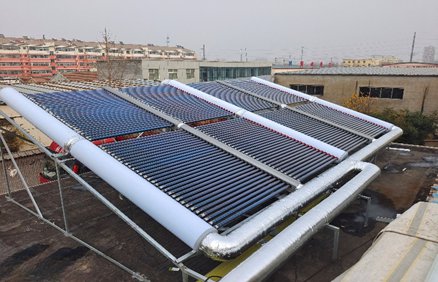
Payback is a financial model, not a catalog specification. Photo: Unsplash (license)
2. Why Commercial Solar Thermal ROI Differs from Solar PV
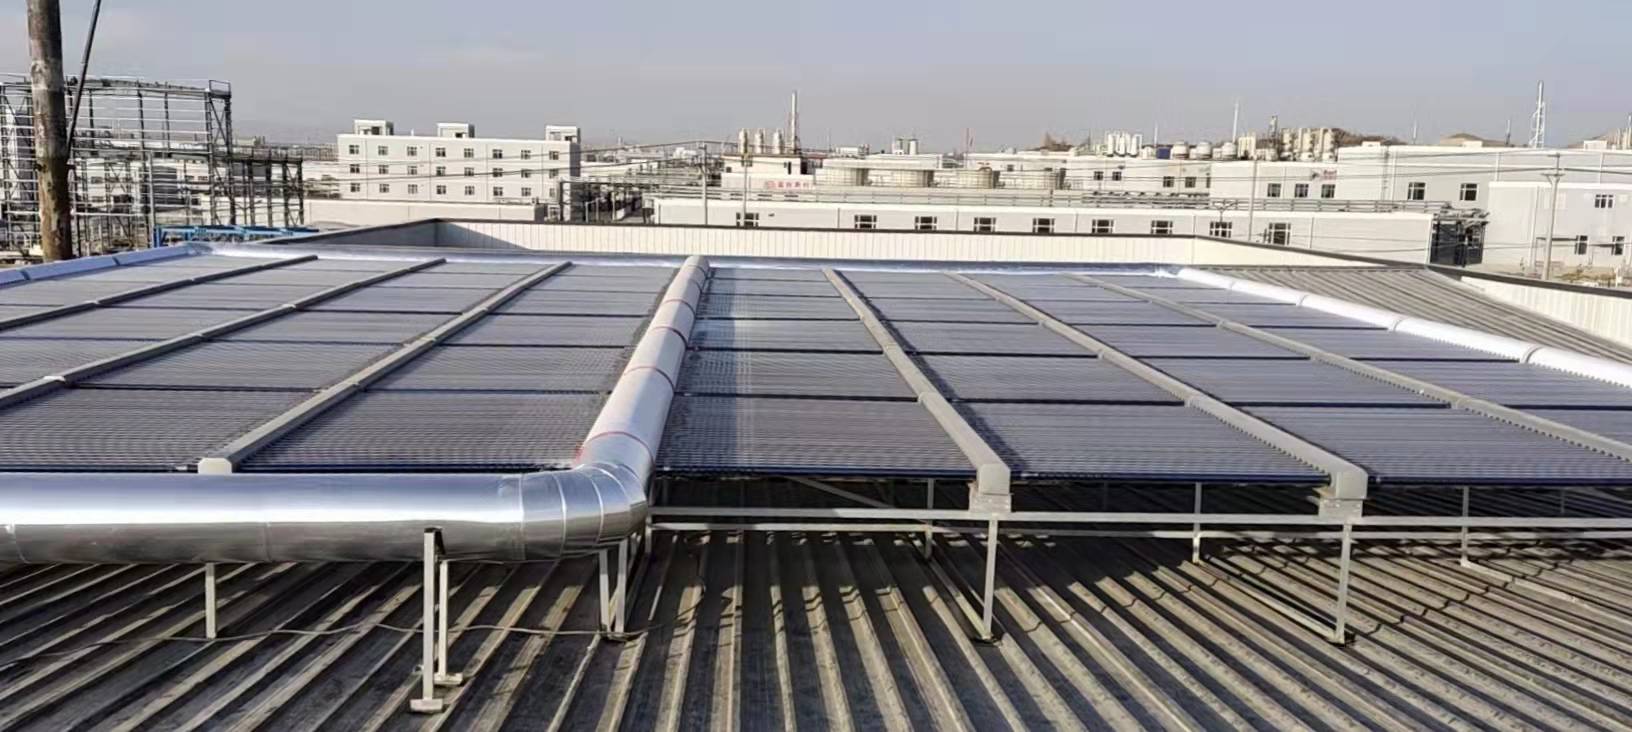
Hospitality and healthcare: steady hot water load supports stronger DHW economics. Photo: Unsplash (license)
Commercial solar hot water is nicht evaluated the same way as commercial PV. PV economics often revolve around electricity offset, self-consumption, export rules, and tariff design. Solar thermal for DHW is simpler in one important sense: it directly offsets purchased heat that would otherwise come from electricity, gas, oil, or another backup source.
That makes the quality and consistency of the hot water load more important than a generic “solar efficiency” number. The best-fit projects are buildings with steady, recurring DHW demand — hotels, hospitals, laundries, dormitories, kitchens, and similar — rather than highly seasonal or erratic loads.
3. Start With the Thermal Load, Not the Sales Claim
A realistic payback model begins with the building’s actual domestic hot water demand — not the collector’s datasheet. If you are comparing hardware options, start from the solar collector product range only after the annual kWh of load is established; otherwise, every €/m² comparison is unmoored from reality.
3.1 Worked Example: 5,000 Litres per Day
Assume a commercial facility uses 5,000 litres of hot water per day and needs a 40 °C temperature rise. Using the common shortcut (water ≈ 1.163 Wh per kg·K; mass ≈ 5,000 kg), the thermal demand is approximately 232.6 kWh per day (5,000 × 40 × 1.163 / 1,000), or ~84,883 kWh per year (annualised).
That thermal demand is then converted into baseline DHW cost for the current heating method. If the building uses a gas boiler at 85% efficiency and energy costs are expressed at $0.06/kWh of fuel, the annual baseline is about $5,992. If the same building used electric-resistance heating at $0.12/kWh (simplified, single-rate illustration), the annual cost is about $10,186.
Die hot water load is identical in both cases. The economics are very different because the avoided energy price is different. This is the single most important factor that many sales proposals skip.
| Kennzahl | Gas boiler baseline (illustration) | Electric resistance (illustration) |
|---|---|---|
| Annual useful thermal (kWh/yr) | ~84,883 | |
| Stated input assumptions | 85% efficiency; $0.06/kWh fuel | 100% efficiency; $0.12/kWh |
| Approx. annual DHW energy cost | ~$5,992 | ~$10,186 |
| Implication for solar economics | Smaller avoided cost per kWh | Larger avoided cost per kWh |
4. The Five Variables That Determine Payback
Each variable below is a model input. If any input is unexamined, the payback can look artificially short — or unnecessarily pessimistic.
From site reality to a payback number
Baseline fuel price → Load shape → Solar fraction → Installed cost → Incentives (if verified)
4.1 Baseline Energy Source
Replacing expensive electricity, LPG, or diesel generally creates a stronger business case than replacing low-cost natural gas. The DOE lists conventional fuel cost among the key economics drivers, and WBDG’s solar water heating resource frames commercial applications and load characteristics alongside technical fundamentals.
4.2 Daily Hot Water Load and Consistency
A system tied to a stable, year-round load produces a more reliable savings line item. A building with large summer shutdowns, intermittent occupancy, or poorly understood usage is much harder to model — and much easier to oversell. If a supplier cannot explain how the load profile was developed, that is a warning sign.
4.3 Solar Fraction — the Most Manipulated Assumption
Solar fraction is the share of annual hot water demand met by the solar sub-system. WBDG notes systems can, in some cases, serve a high share of needs — but “up to” is not the same as “expected in every project.” A defensible value must reflect climate, collector area, storage, load profile, and backup integration. Ask: What solar fraction are you assuming, and which simulation method produced it?
4.4 Installed Cost and System Complexity
Two projects with the same gross collector area can have very different payback if one requires structural upgrades, long pipe runs, complex controls, or difficult integration with existing mechanical systems. The installed $/m² of collector is a site result — not a distributor list price.
4.5 Incentives and Tax Treatment
Incentives can move payback materially — but they should be a scenario layer, not a default stamp. In the U.S., teams should cross-check DSIRE and current IRS/treasury guidance; in the EU and MENA, confirm whether a programme actually covers commercial solar thermal (many are PV-oriented).
5. A Transparent Example: Gas vs. Electric Payback
Apply a 55% solar fraction to the Section 3 example. In the gas-boiler case, annual savings are about $3,295. In the electric-resistance case, annual savings are about $5,602 — same system concept, very different financial outcome, because the displaced $/kWh differs.
On a system with a $15,000 installed cost (illustration only), simple payback is ~4.55 years for gas und ~2.68 years for electricity. This is the “one diagram should change your review process” lesson: the same project can be acceptable against cheap gas and excellent against expensive electricity. That is how avoided-cost projects behave — and it matches the pattern in DOE/NREL discussions of fuel displacement.
| Artikel | Gas baseline | Elektrischer Widerstand |
|---|---|---|
| Assumed annual savings @ 55% solar fraction | ~$3,295/yr | ~$5,602/yr |
| Simple payback @ $15,000 installed | ~4.55 years | ~2.68 years |
| Reading for procurement | Validate the baseline fuel, tariff structure, and maintenance before using these figures for a sign-off | |
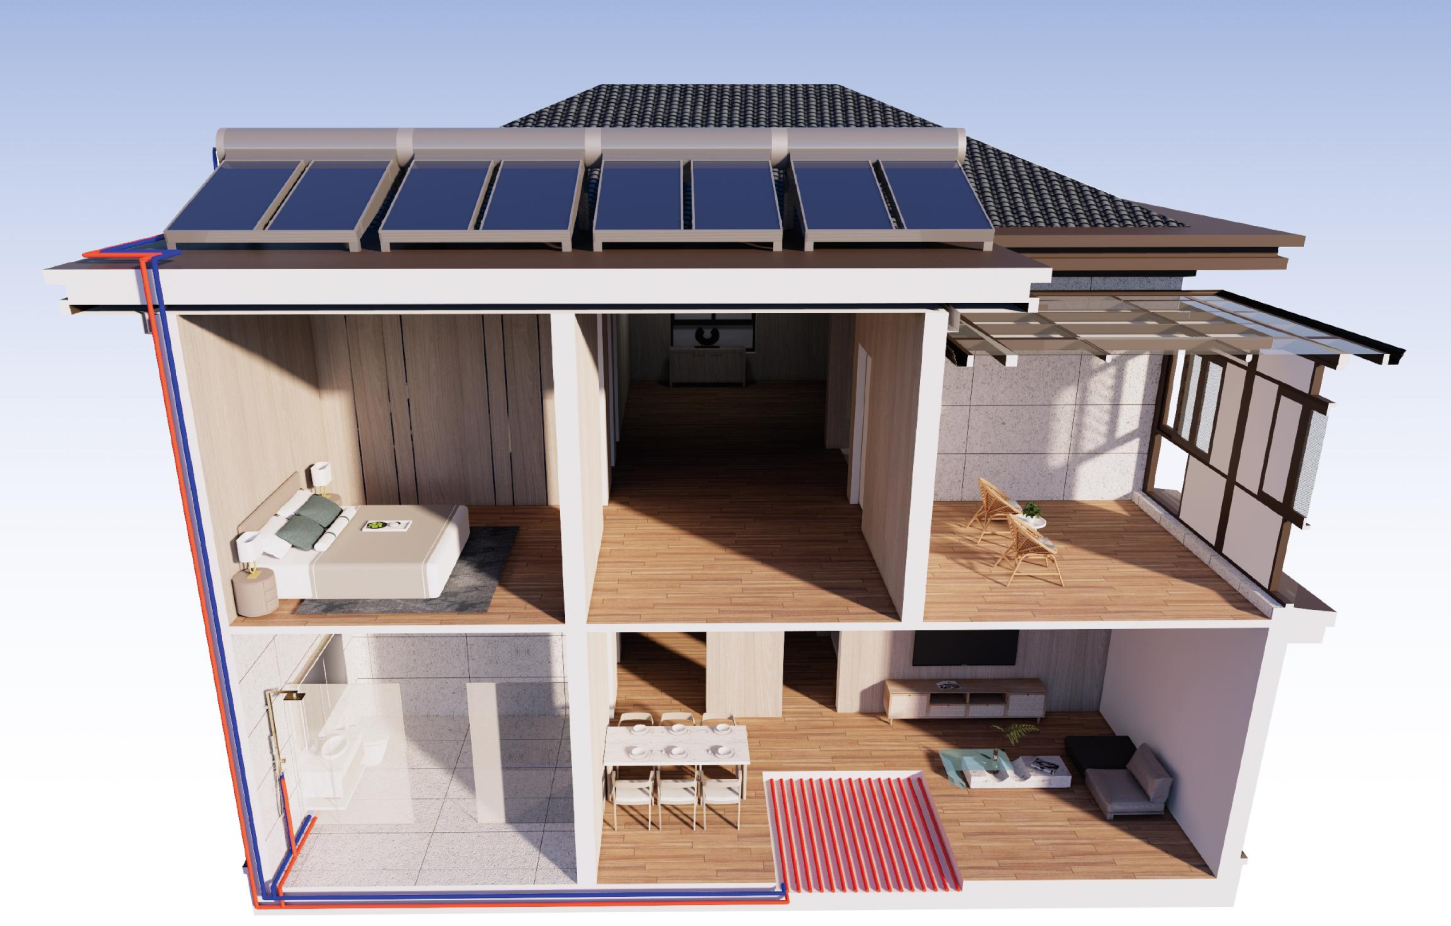
The baseline fuel and tariff band matter as much as collector performance in payback. Photo: Unsplash (license)
6. How Incentives Affect Payback — and Why They Must Be Verified
If a project’s net capital cost falls from $15,000 to $10,500 after a 30% cost reduction (used here nur as a maths example), simple payback drops to ~3.19 years for gas und ~1.87 years for electricity at the same savings levels as Section 5. This shows why incentives matter — and why they must be a tracked assumption with documentation.
Do not import yesterday’s tax credit into next week’s decision
Outdated incentive claims are one of the most common payback landmines. A credible EPC or manufacturer will verify eligibility, or will clearly mark payback before incentives as the official baseline. U.S. teams should use DSIRE and current IRS/3468 context; EU projects should read national programme rules in full.
7. Why Many Commercial DHW ROI Claims Are Overstated
Common Modelling Pitfalls
- Inflated solar fraction without climate + load + storage co-simulation
- Ignoring OPEX: pumps, controls, and periodic maintenance / fluid service
- Conflating simple payback with NPV, IRR, escalation, and load risk (what if occupancy changes?)
What a Serious Model Should Include
- DOE-consistent point that maintenance for simple systems can be infrequent (multi-year cycles) — but still budgeted
- Indirect systems: antifreeze replacement on a defensible schedule (commonly 3-5 Jahre as a planning interval)
- Leadership review of NPV / IRR / downside cases, not a single “year 0” headline
8. Which Projects Usually Get the Fastest Return
The strongest commercial solar DHW projects typically show three site characteristics: high daily consumption, predictable year-round use, und expensive conventional heating. In practice: hospitality, healthcare, student housing, laundries, and industrial kitchens — plus adjacent uses where 40–70 °C water is consumed on a continuous basis. Use the gewerblichen Solar-Warmwassersysteme category as a system-level map once your load and baseline fuel are understood.
Hospitals and 24/7 care: stable base load improves solar utilisation. Photo: Unsplash (license)
Projects often struggle not because solar “fails”, but because avoided cost is small — low DHW use, high seasonality, or very cheap fuel and limited hours. In those cases, the capital return timeline may not be competitive, even with good hardware.
9. What to Look for in a Manufacturer When Payback Matters
When payback is central to the decision — in commercial work, that is almost always — engineering depth matters more than a headline η0 on a brochure. A strong partner should:
- Provide thermal simulation off your actual load profile (not a PDF generic)
- State the target solar fraction and the method (e.g. climate + simulation + boundary conditions)
- Deliver system inputs: storage sizing, circulation concept, backup integration, hydraulic balance
Soletks Solar takes an engineering-first path. As a factory-based manufacturer, Soletks supplies project-specific system sizing, ROI analysis, und hydraulic design support — not a parts-only price list. When payback is on the line, the difference between a component vendor and a system-capable manufacturer is often the difference between a model that matches operations and one that does not.
For the hardware that carries thermal yield, review flat plate solar collectors designed for commercial applications — the workhorse for many forced-circulation and large-array designs. For high-duty, space-constrained projects, the EFPC series engineering collectors target hotels, hospitals, and industrial sites, with ultrasonic-welded absorber construction und low heat-loss insulation chambers for stable, long-term output.
The credible win is not the proposal with the shortest payback in the cover email — it is the proposal whose assumptions can survive your fuel tariffs, your load meter data, and your O&M plan.
10. The Bottom Line
There is no universal payback for a commercial solar hot water system. A defensible result requires measured or estimated load, a clear baseline fuel and tariff, a simulation-backed solar contribution, a reality-checked installed cost, und incentives that are verified for that exact site and timeline. In the illustrated example, simple payback is ~4.6 years against gas and ~2.7 years against electric resistance, vorher any incentive adjustment. If you are still comparing technology paths, the solar collector product range is the right catalogue layer once your thermal load line is set.
Next Step: Make the Model Match Your Site
Choose the path that matches your stage: engineering consultation, quick collector pricing, or a partnership / distribution discussion.
Engineering & ROI
Send building type, estimated daily DHW, roof layout, minimum winter temperature, and current heat source. We will return a preliminary system concept with ROI — not only a list price.
Request a consultation →Quick quote
Already in detailed design? Share collector area, system type (thermosiphon or forced), and destination. Quotation-style feedback within 48 hours.
Get a quick quote →Partners & distributors
Factory-direct solar thermal with engineering support for EPCs, integrators, and channel partners in Europe, MENA, Africa, and Latin America.
Explore partnership →Email: export@soletksolar.com · service.soletksolar.com/contact
Häufig gestellte Fragen
What is a “good” payback period for a commercial solar hot water system?
There is no single benchmark. Projects displacing expensive electricity or diesel in stable, high-volume DHW applications often see 2–4 year simple payback; projects on cheap gas und moderate load may be 4–6+ years. The DOE frames economics around hot water use, performance, site, incentives, and fuel price.
Is DHW ROI better when replacing electricity or gas?
In most cases, yes — electricity (especially resistance) has higher avoided $/kWh than piped gas, which strengthens ROI. NREL’s solar-thermal work frequently emphasises the electric-resistance displacement case (verify against your actual tariff structure).
Do commercial systems still need backup heating?
In virtually all commercial applications, ja. Annual solar shares of 50–75% are realistic in well-designed systems, but backup (boiler, heat pump, or element) is standard to cover peaks and low-irradiance periods.
How much maintenance should be in the model?
Budget for periodic inspection of pumps, valves, and controls, plus glycol service in indirect systems. The DOE notes simple systems may only need work every 3-5 Jahre — at commercial scale, many teams still add a conservative annual O&M allowance in lifecycle models.
Should incentives be in the payback line?
Only after you confirm eligibility for the project address, product category, and timeline. Treat incentive payback as a scenario row. U.S. teams cross-check DSIRE and IRS/3468 context; in Europe and MENA, read whether a scheme funds thermal or PV only.
How does solar thermal compare to a heat pump for commercial DHW?
They have different OPEX profiles. Solar thermal is strong where irradiance is good und avoided conventional energy is expensive. Heat pumps add COP, but still draw electricity. Many warm / high-irradiance sites favour solar for payback; some designs combine both.