
Commercial Solar Hot Water Payback Calculation: Fuel, Load and Solar Fraction
Commercial solar hot water payback calculation guide with fuel savings, solar fraction, NPV, IRR, carbon value, sensitivity checks, and RFQ inputs.
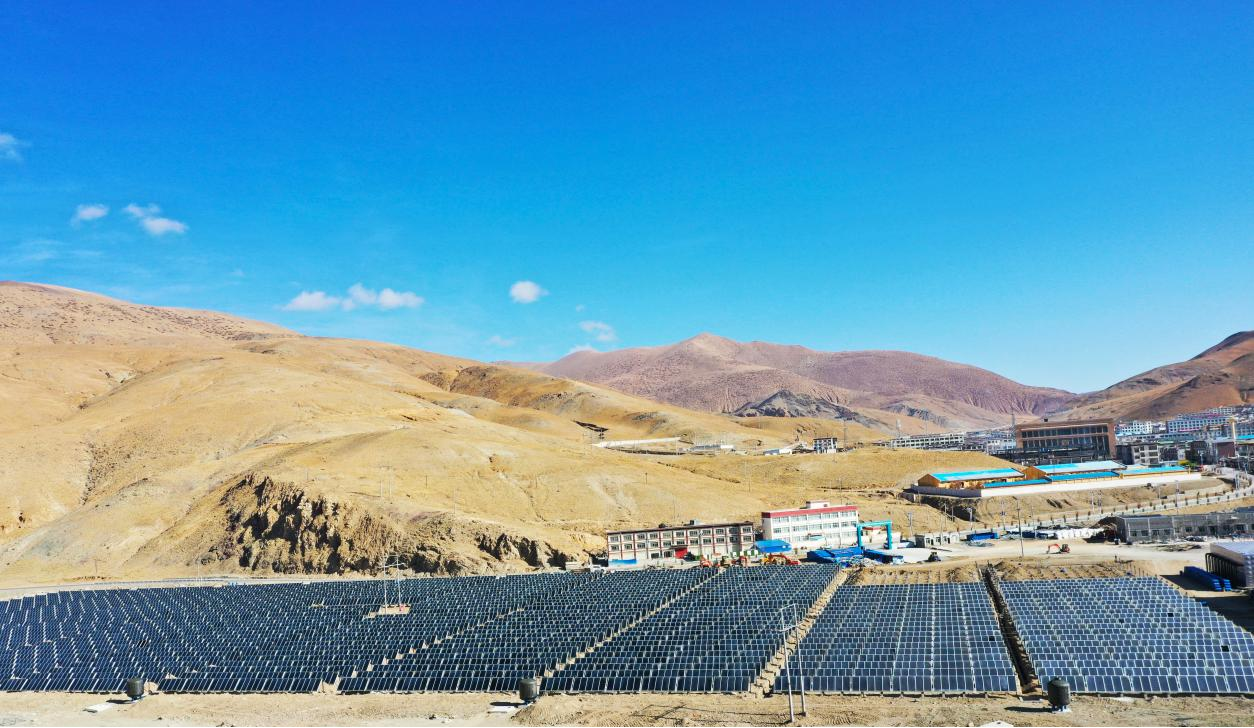
За даними Інженерна команда SOLETKS — підрозділ з виробництва комерційних сонячних теплових систем у компанії, що входить до п’ятірки провідних світових виробників плоских колекторів, з 117+ патентів. We build payback models across project scales from 200 L/day Florida resort villas through 50 t/day urban hotels (APEC Summit, Beijing — ~150,000 kWh/year and ~74 tonnes CO₂/year avoided since 2014) to the Централізована теплоелектростанція площею 107 000 м² у повіті Сага, Тибет (~2,424 tonnes coal/year displaced since 2019).
Scope boundary: this article is a project-finance screening model for fuel savings, NPV, IRR, and sensitivity analysis. It does not replace collector selection, hydraulic design, storage sizing, procurement-scope comparison, or facility hygiene engineering.
TL;DR — Коротка відповідь
A commercial solar hot water payback calculation залежить від 8 inputs, not 1:
- Metered hot-water load (L/day, ΔT, operating days)
- Fuel price (USD/kWh — use real utility bill, not national average)
- Backup-heater efficiency (boilers 80–92%, heat pumps COP 2.5–4.0)
- Сонячна фракція (40–65% typical for commercial)
- Installed system cost (turnkey, not just collector price)
- Annual maintenance cost (~2–4% of installed cost)
- Confirmed incentives (verified — not anticipated)
- Discount rate (for NPV / IRR — typically 5–10% commercial)
Do not trust a fixed payback claim without these 8 inputs. A hotel using expensive electricity with stable daily hot water can pay back in 3–5 років. A seasonal facility with cheap fuel and weak storage utilization can stretch to 10–15 років.
Основні висновки:
1. Обчислити annual hot-water energy first.
2. Convert solar heat into avoided fuel cost (include backup efficiency).
3. Subtract maintenance cost (don’t ignore it).
4. Include incentives only when confirmed.
5. Compare simple payback with lifecycle value over 10–20 years — solar thermal systems run 20+ years.
For system sizing, see the Комерційна / промислова сонячна система гарячого водопостачання. For collector choice, compare the Сонячний колектор family against actual operating temperature.[1]
1. Payback Answer
Commercial solar hot water payback is the installed net cost divided by annual net savings. Pacific Northwest National Laboratory operations guidance treats solar water-heating systems as assemblies with collectors, storage, pumps, controls, and backup heat — so payback must include the whole system, not collector cost alone.[2] ASHRAE’s HVAC Applications Handbook reinforces that service water heating ROI must include backup-heater efficiency + maintenance + measured load, not collector cost alone.[10] Fraunhofer ISE’s long-term commercial monitoring shows that measured solar fraction in well-maintained plants is typically within 5–10% of design — making well-built systems financially predictable.[11]
Simple payback = (installed cost − confirmed incentives)
                 ÷ (annual fuel savings − annual maintenance cost)
This number is useful for screening, but it is not the full investment decision. Buyers should also compare:
- Lifecycle value (10-year, 20-year)
- Fuel-price sensitivity
- Maintenance responsibility (DIY vs contractor)
- Carbon / ESG reporting value
- Hot-water reliability (downtime cost avoided)
Payback changes quickly because hot-water energy is a multiplication of volume × ΔT × operating days × fuel price.
2. Worked Payback Calculation
Примітка щодо джерела: all fuel prices and costs below are example inputs; replace them with project quotes, utility bills, and local tariffs before purchase approval.[2]
Приклад вхідних даних
| Параметр | Цінність |
|---|---|
| Щоденний обсяг гарячої води | 12,000 L/day |
| Вхід для холодної води | 15 °C |
| Delivery target | 55 °C |
| Підвищення температури (ΔT) | 40 °C |
| Operating days | 330 days/year |
| Сонячна фракція | 55% |
| Backup fuel cost | 0.11 USD/kWh |
| Backup heater efficiency | 90% |
| Installed solar thermal cost | 62,000 USD |
| Annual maintenance cost | 1,200 USD/year |
| Confirmed incentive | 8,000 USD |
Формула
Daily heat demand    = liters × ΔT × 4.186 / 3600
Annual useful solar  = daily heat × operating days × solar fraction
Avoided fuel energy  = annual useful solar / heater efficiency
Annual gross savings = avoided fuel energy × fuel cost
Net installed cost   = installed cost − incentives
Simple payback       = net installed cost ÷ (gross savings − maintenance)
Заміна
Daily heat demand    = 12,000 × 40 × 4.186 / 3600     = 558 kWh/day
Annual useful solar  = 558 × 330 × 55%                = 101,277 kWh/year
Avoided fuel energy  = 101,277 ÷ 0.90                 = 112,530 kWh/year
Annual gross savings = 112,530 × 0.11                 = 12,378 USD/year
Net annual savings   = 12,378 − 1,200                 = 11,178 USD/year
Net installed cost   = 62,000 − 8,000                 = 54,000 USD
Simple payback       = 54,000 ÷ 11,178                ≈ 4.8 years
Recommendation: this project is a good payback candidate if the load is stable, storage holds useful heat, and fuel price is confirmed. If actual solar fraction falls from 55% → 40%, annual useful solar drops to ~73,656 kWh/year — changing payback significantly.
3. Real Project Payback Reference Points
| Project | Year | Annual fuel avoided | Approx. value at typical tariff | Payback signal |
|---|---|---|---|---|
| APEC Summit hotel (Beijing) | 2014 | ~150,000 kWh/year | ~15,000 USD/year @ 0.10 USD/kWh | Strong (stable 50 t/day hotel load) |
| Harz church (Germany) | 2021 | Parish fuel reduction | Local price-dependent | Strong (continuous demand) |
| Saga County (Tibet) | 2019 | ~2,424 tonnes coal/year displaced | ~120,000–180,000 USD/year fuel equivalent[a] | Very strong (centralized heating + carbon value) |
| Florida resort villas | 2022 | Per-villa fuel reduction | Depends on local electricity | Moderate (seasonal occupancy) |
[a] Coal value estimated from displaced energy content × regional fuel cost; replace with project’s actual tariff before procurement decisions.
Insight: the APEC Summit hotel’s ~15,000 USD/year saving at hotel-scale is a real, measurable benchmark — not a marketing estimate. Multiply 12+ years of operation = ~180,000 USD of avoided fuel so far. This is the kind of multi-year compounded value that simple payback alone misses.
4. Payback Sensitivity Matrix
Payback changes quickly when fuel cost, solar fraction, or installed cost changes. This matrix uses the same load as the worked example.
Примітка щодо джерела: calculated scenarios from example inputs, not market-wide guarantees.[2]
| Сценарій | Сонячна фракція | Fuel cost | Net annual savings | Simple payback |
|---|---|---|---|---|
| Conservative | 40% | 0.08 USD/kWh | 5,341 USD/year | 10.1 years |
| Base case | 55% | 0.11 USD/kWh | 11,178 USD/year | 4.8 years |
| High-fuel case | 55% | 0.16 USD/kWh | 17,430 USD/year | 3.1 years |
| Better utilization | 65% | 0.11 USD/kWh | 13,430 USD/year | 4.0 years |
| EU energy crisis case | 55% | 0.25 USD/kWh | 28,256 USD/year | 1.9 years |
Mechanism rule: higher solar fraction improves payback only when the building can use the heat. Oversized collectors without storage raise stagnation risk and maintenance cost — the spreadsheet looks better while the plant performs worse.
5. Global Commercial Fuel Price Reference
Payback varies dramatically by region. Approximate 2025 commercial natural gas / electricity tariffs for hot-water backup:
| Регіон | Typical commercial gas (USD/kWh equivalent) | Typical commercial electricity (USD/kWh) | Solar payback signal |
|---|---|---|---|
| Germany / EU (post-energy crisis) | 0.12–0.18 | 0.25–0.40 | Відмінний |
| UK | 0.10–0.14 | 0.22–0.32 | Very strong |
| Spain / Italy / Portugal | 0.09–0.13 | 0.18–0.28 | Very strong |
| USA (commercial) | 0.04–0.07 | 0.10–0.16 | Strong |
| China (urban commercial) | 0.04–0.06 | 0.08–0.12 | Moderate (gas-cheap) |
| MENA / Gulf | 0.02–0.05 | 0.06–0.12 | Limited (fuel-cheap, but high cooling demand) |
| Sub-Saharan Africa | 0.06–0.10 | 0.15–0.25 | Strong (electricity expensive) |
| Південно-Східна Азія | 0.05–0.08 | 0.10–0.18 | Strong (electricity + carbon push) |
Always replace these with actual project utility bills — variation within a country is large (urban vs rural, peak vs off-peak, contract size).
6. NPV and IRR — The CFO View
Simple payback is a screening tool. For projects requiring CFO / treasury approval, calculate NPV та IRR.
Net Present Value (NPV)
NPV = − net installed cost
      + Σ [ annual net savings ÷ (1 + r)^n ]   for n = 1 to lifetime years

Where r = discount rate (typically 5–10% commercial)
For the worked example
| Параметр | Цінність |
|---|---|
| Net installed cost | 54,000 USD |
| Annual net savings | 11,178 USD/year |
| Discount rate | 7% |
| System lifetime | 20 років |
| Annuity factor (20 yr @ 7%) | ~10.59 |
NPV  ≈ −54,000 + 11,178 × 10.59
     ≈ −54,000 + 118,375
     ≈ +64,375 USD positive NPV
IRR (approximation)
For this cash flow profile with simple payback ~4.8 years and 20-year life:
IRR ≈ 20–22% (well above typical 7% cost of capital)CFO rule of thumb: a commercial solar thermal project with IRR > 12% is competitive with most other facility upgrades; IRR > 18% is exceptional.
7. Carbon Value Sensitivity
Carbon-reduction value is moving from “nice to have” to “material” — especially for:
- EU-listed companies (CSRD reporting)
- Multinationals with Scope 1+2 targets
- ESG-linked financing
- Buildings seeking LEED / BREEAM / WELL certification
Illustrative carbon-value scenarios
The prices below are sensitivity inputs, not live allowance quotations. Confirm eligibility and replace them with the buyer’s current regulated, voluntary, or internal carbon value before approving an investment.
| Project | Annual CO₂ avoided | Scenario @ 80 EUR/tonne | Scenario @ 30 USD/tonne |
|---|---|---|---|
| APEC Summit hotel | 74 tonnes/year | ~5,920 EUR/year | ~2,220 USD/year |
| Saga County (Tibet) | ~5,800–6,500 tonnes/year[b] | ~480,000 EUR/year | ~180,000 USD/year |
| Worked example (12 t HW/day) | ~28–35 tonnes/year[c] | ~2,400 EUR/year | ~900 USD/year |
[b] Estimated from 2,424 tonnes coal × ~2.4–2.7 tonnes CO₂ per tonne of coal (Chinese bituminous coal emissions factor).
[c] Estimated from 112,530 kWh/year backup gas × ~0.25 kg CO₂/kWh.
Insight: carbon value can shorten modeled payback only when that value is eligible, realizable, and included consistently in the cash flow. Treat it as a sensitivity case until verified.
8. What Improves ROI
Commercial ROI improves when the solar system offsets expensive and predictable heat. It weakens when the load is seasonal, storage is too small, backup heat fights solar, or roof access makes maintenance costly.
| Lever | Payback effect | Design rule |
|---|---|---|
| Stable daily hot-water load | ✅ Faster | Use solar where building uses heat every day |
| Higher backup fuel cost | ✅ Faster | Use actual utility bills, not national averages |
| Correct storage volume | ✅ Faster | Store heat for peak draw windows |
| Strong controls | ✅ Faster | Avoid heating whole tank before solar hours |
| EU / UK location | ✅ Faster | High fuel costs + carbon value |
| Poor maintenance access | ❌ Slower | Include service walkway + valve access |
| Weak metering | ❌ Higher uncertainty | Add flow + temperature logging |
| Seasonal load | ❌ Slower | Mismatched supply ↔ demand |
| Cheap fuel region | ❌ Slower | Carbon value may still tip the case |
For tank sizing rules, see Розрахунок розмірів комерційних сонячних баків для зберігання гарячої води. For maintenance-driven yield protection, see План експлуатації та технічного обслуговування комерційних сонячних теплових систем.
9. Lifecycle Cost View
Simple payback ignores what happens after the payback year. A procurement team should compare 10-year and 20-year operating value — especially when the buyer has carbon or fuel-risk targets.
| Предмет | 10-year planning value | 20-year planning value |
|---|---|---|
| Annual net savings × years | 111,780 USD | 223,560 USD |
| Net installed cost | 54,000 USD | 54,000 USD |
| Net value before major replacement | +57,780 USD | +169,560 USD |
| Maintenance included | 12,000 USD | 24,000 USD |
| Pump replacement allowance | + 1 cycle | + 2–3 cycles |
| Carbon value (EU @ 80 EUR/t) | + ~24,000 EUR | + ~48,000 EUR |
These values are not a guarantee. They are a framework for comparing a solar hot-water plant with boiler-only operation, heat pump upgrades, or combined solar + heat pump systems.
For PVT-heat-pump comparison, see Сонячні панелі PVT з тепловим насосом.
10. Стандарти та документація
ROI documents should connect financial assumptions to technical evidence. If the collector output, pressure boundary, or control system is not documented, the payback model is not bankable.
| Стандарт / сертифікат | Сфера застосування | Правило щодо запиту на пропозицію |
|---|---|---|
| ISO 9806:2017 | Collector test methods | Use model data for yield assumptions.[4] |
| cURL Too many subrequests. | Європейська сертифікація колекціонерів | Required for EU certified collector evidence.[5] |
| ISO 9001 | Управління якістю | Докази щодо процесів постачальників.[6] |
| UL 508A | Панелі управління | UL-market panel.[7] |
| ASME BPVC | Обладнання, що працює під тиском | Правила щодо резервуарів/посудин, що знаходяться під тиском.[8] |
| NSF/ANSI 61 | Контакт із питною водою | Drinking-water approval.[9] |
11. RFQ Inputs for SOLETKS
Зверніться за технічною підтримкою через Сторінка контактів SOLETKS when payback, system sizing, and technical scope must be reviewed together.
Load
- Daily hot-water volume, operating days, peak draw window
- Cold-water inlet + target delivery temperature
Backup + utility
- Current fuel type, fuel cost (utility bill), heater efficiency
- Carbon-reduction target (if any)
Site
- Roof area, shading, installation access, plant-room space
- Desired solar fraction
Finance
- Discount rate or hurdle IRR
- Lifecycle horizon (10-year / 20-year)
- Reporting needs (ESG, CSRD, LEED, BREEAM)
12. Specification Checklist
| Предмет | Обов’язкове значення |
|---|---|
| Heat load | kWh/day and kWh/year |
| Сонячна фракція | % and basis |
| Fuel cost | USD/kWh or local tariff (actual bill) |
| Backup efficiency | % |
| Вартість з монтажем | Equipment + installation + shipping + commissioning |
| Maintenance cost | Annual service + replacement allowances |
| Incentives | Confirmed value + eligibility |
| Carbon value | If ESG / CSRD reporting required |
| Discount rate | % (for NPV / IRR) |
| Measurement plan | Flow, temperature, runtime, fuel use |
Часті питання
What is a good payback period for commercial solar hot water?
A good payback period depends on fuel price, hot-water load, installed cost, solar fraction, and maintenance cost. The worked example gives 4.8 years; the same load can shift from 1.9 years (EU energy-crisis fuel prices) to cURL Too many subrequests. (cheap-fuel region or weak utilization). Real reference: APEC Summit hotel in Beijing saves ~15,000 USD/year at hotel scale.
Why do payback claims vary so much?
Payback claims vary because projects use different fuel tariffs, daily loads, backup efficiency, incentives, installation cost, and maintenance assumptions. A claim without liters/day, ΔT, solar fraction, and fuel price is not useful for procurement.
Does a higher solar fraction always improve ROI?
No. Higher solar fraction improves ROI only when the building can use the collected heat AND storage prevents stagnation. Oversizing collectors to chase a higher percentage can raise maintenance cost and reduce reliability if the load is seasonal or storage is too small.
What NPV / IRR should I expect from commercial solar thermal?
There is no universal expected IRR. Calculate it from the project’s installed cost, measured load, fuel tariff, maintenance, incentives, discount rate, and service life. The worked example on this page produces an illustrative IRR of about 20–22%; it is not a market benchmark.
How does carbon value affect commercial solar thermal payback?
Carbon value affects payback only when the project can recognize an eligible allowance, incentive, or internal carbon price. The 80 EUR/tonne scenario above is an illustrative sensitivity input, not a live EU ETS quotation; replace it with the buyer’s current eligible value.
How long does a commercial solar hot water system last?
Properly maintained commercial solar hot water systems deliver Понад 20 років of useful service. Lifecycle value (10–20 years) typically 2–3× the simple-payback value — which is why CFOs increasingly want NPV / IRR analysis, not just payback.
What data does SOLETKS need for a payback review?
Hot-water volume, inlet + outlet temperatures, operating days, fuel cost (utility bill), backup efficiency, roof area, storage plan, desired solar fraction, documentation requirements, discount rate, and any carbon / ESG reporting needs. Utility bills + measured flow data make the payback calculation much more reliable.
Can SOLETKS provide a bankable feasibility study?
For full-system and EPC-turnkey projects (Path 3 in the procurement guide), SOLETKS can prepare engineering documentation that supports bankable feasibility — collector test reports, hydraulic drawings, commissioning sheets, maintenance plan. Reference: Saga County, Tibet (2019) is documented as “the world’s first full-chain turnkey solar heating project”.
How does solar thermal payback compare to PV or heat pump?
| Технологія | Typical commercial IRR | Best fit |
|---|---|---|
| Solar thermal (hot water) | 12–25% | Stable daily HW demand, expensive backup fuel, EU/UK markets |
| PV (electric, self-consumption) | 8–18% | Daytime electricity load, no HW demand, high electricity tariff |
| Heat pump (air-source) | 6–15% | Replaces electric or oil heating, year-round demand |
| PVT hybrid (heat + electric) | 10–22% | Limited roof, mixed heat + electricity demand |
| Solar thermal + heat pump (PVT Pro+) | 14–28% | Strong commercial signal in EU + cold climates |
Key insight: solar thermal wins on hot-water-heavy commercial loads (hotels, hospitals, dormitories, factories). PV wins on daytime electricity-heavy loads. The Фотоелектрична установка PVT Pro+ у школі в Тяньцзіні (2024 р., 3 000 м²) combines both for hybrid demand profiles. For a building owner, the right answer is often a mix — solar thermal for HW + PV for electricity + heat pump for winter peak — not a single technology.
Джерела
[1] SOLETKS, Комерційна / промислова сонячна система гарячого водопостачання.
[2] Національна лабораторія Тихоокеанського Північного Заходу, Сонячні системи нагріву води.
[3] SOLETKS, Гарантія якості.
[4] ISO, ISO 9806:2017 Сонячна енергія. Сонячні теплові колектори. Методи випробувань.
[5] Solar Keymark, Система сертифікації Solar Keymark.
[6] ISO, ISO 9001:2015 «Системи управління якістю».
[7] UL Solutions, Промислові панелі управління — UL 508A.
[8] ASME, Норми щодо котлів та посудин під тиском.
[9] NSF, Стандарти для систем очищення води, зокрема в контексті стандарту NSF/ANSI 61.
[10] ASHRAE, Довідник ASHRAE — Розділ «Системи опалення, вентиляції та кондиціонування повітря: нагрівання води для побутових потреб».
[11] Інститут сонячних енергетичних систем імені Фраунгофера (ISE), Long-term Commercial Solar Thermal Monitoring.
Engineering review completed: 2025-07-05 by SOLETKS Engineering Team. Publication QA updated: 2026-08-10. Project data referenced: APEC Summit hotel (Beijing, 2014, ~150,000 kWh/year avoided ≈ ~15,000 USD/year), Harz church (Germany, 2021), Saga County (Tibet, 2019, ~2,424 t coal/year displaced), Florida resort villas (USA, 2022), Tianjin school PVT Pro+ (2024, 3,000 m² hybrid).
Потрібна інженерна експертиза конкретного проєкту?
Надішліть компанії SOLETKS інформацію про кліматичні умови на об’єкті, добове навантаження, обмеження, пов’язані з дахом або технічним приміщенням, перелік обладнання та цільові вимоги до документації, щоб інженерна команда могла надати практичну комерційну рекомендацію.
Зв’яжіться з SOLETKS